Introducing the newest feature addition to the Spark ecosystem: Spark Analytics!
Whether you’re managing one project or several, Analytics makes reporting easier, faster, and smarter. You'll gain the ability to dive deeper into your valuable data and make informed decisions to successfully sell out your developments.
Why We Built This
Reliable data is the foundation of a successful project sales program. We have rebuilt our reporting tool from the ground up to give you Spark Analytics: a comprehensive reporting suite specifically tailored for the new development real estate industry.
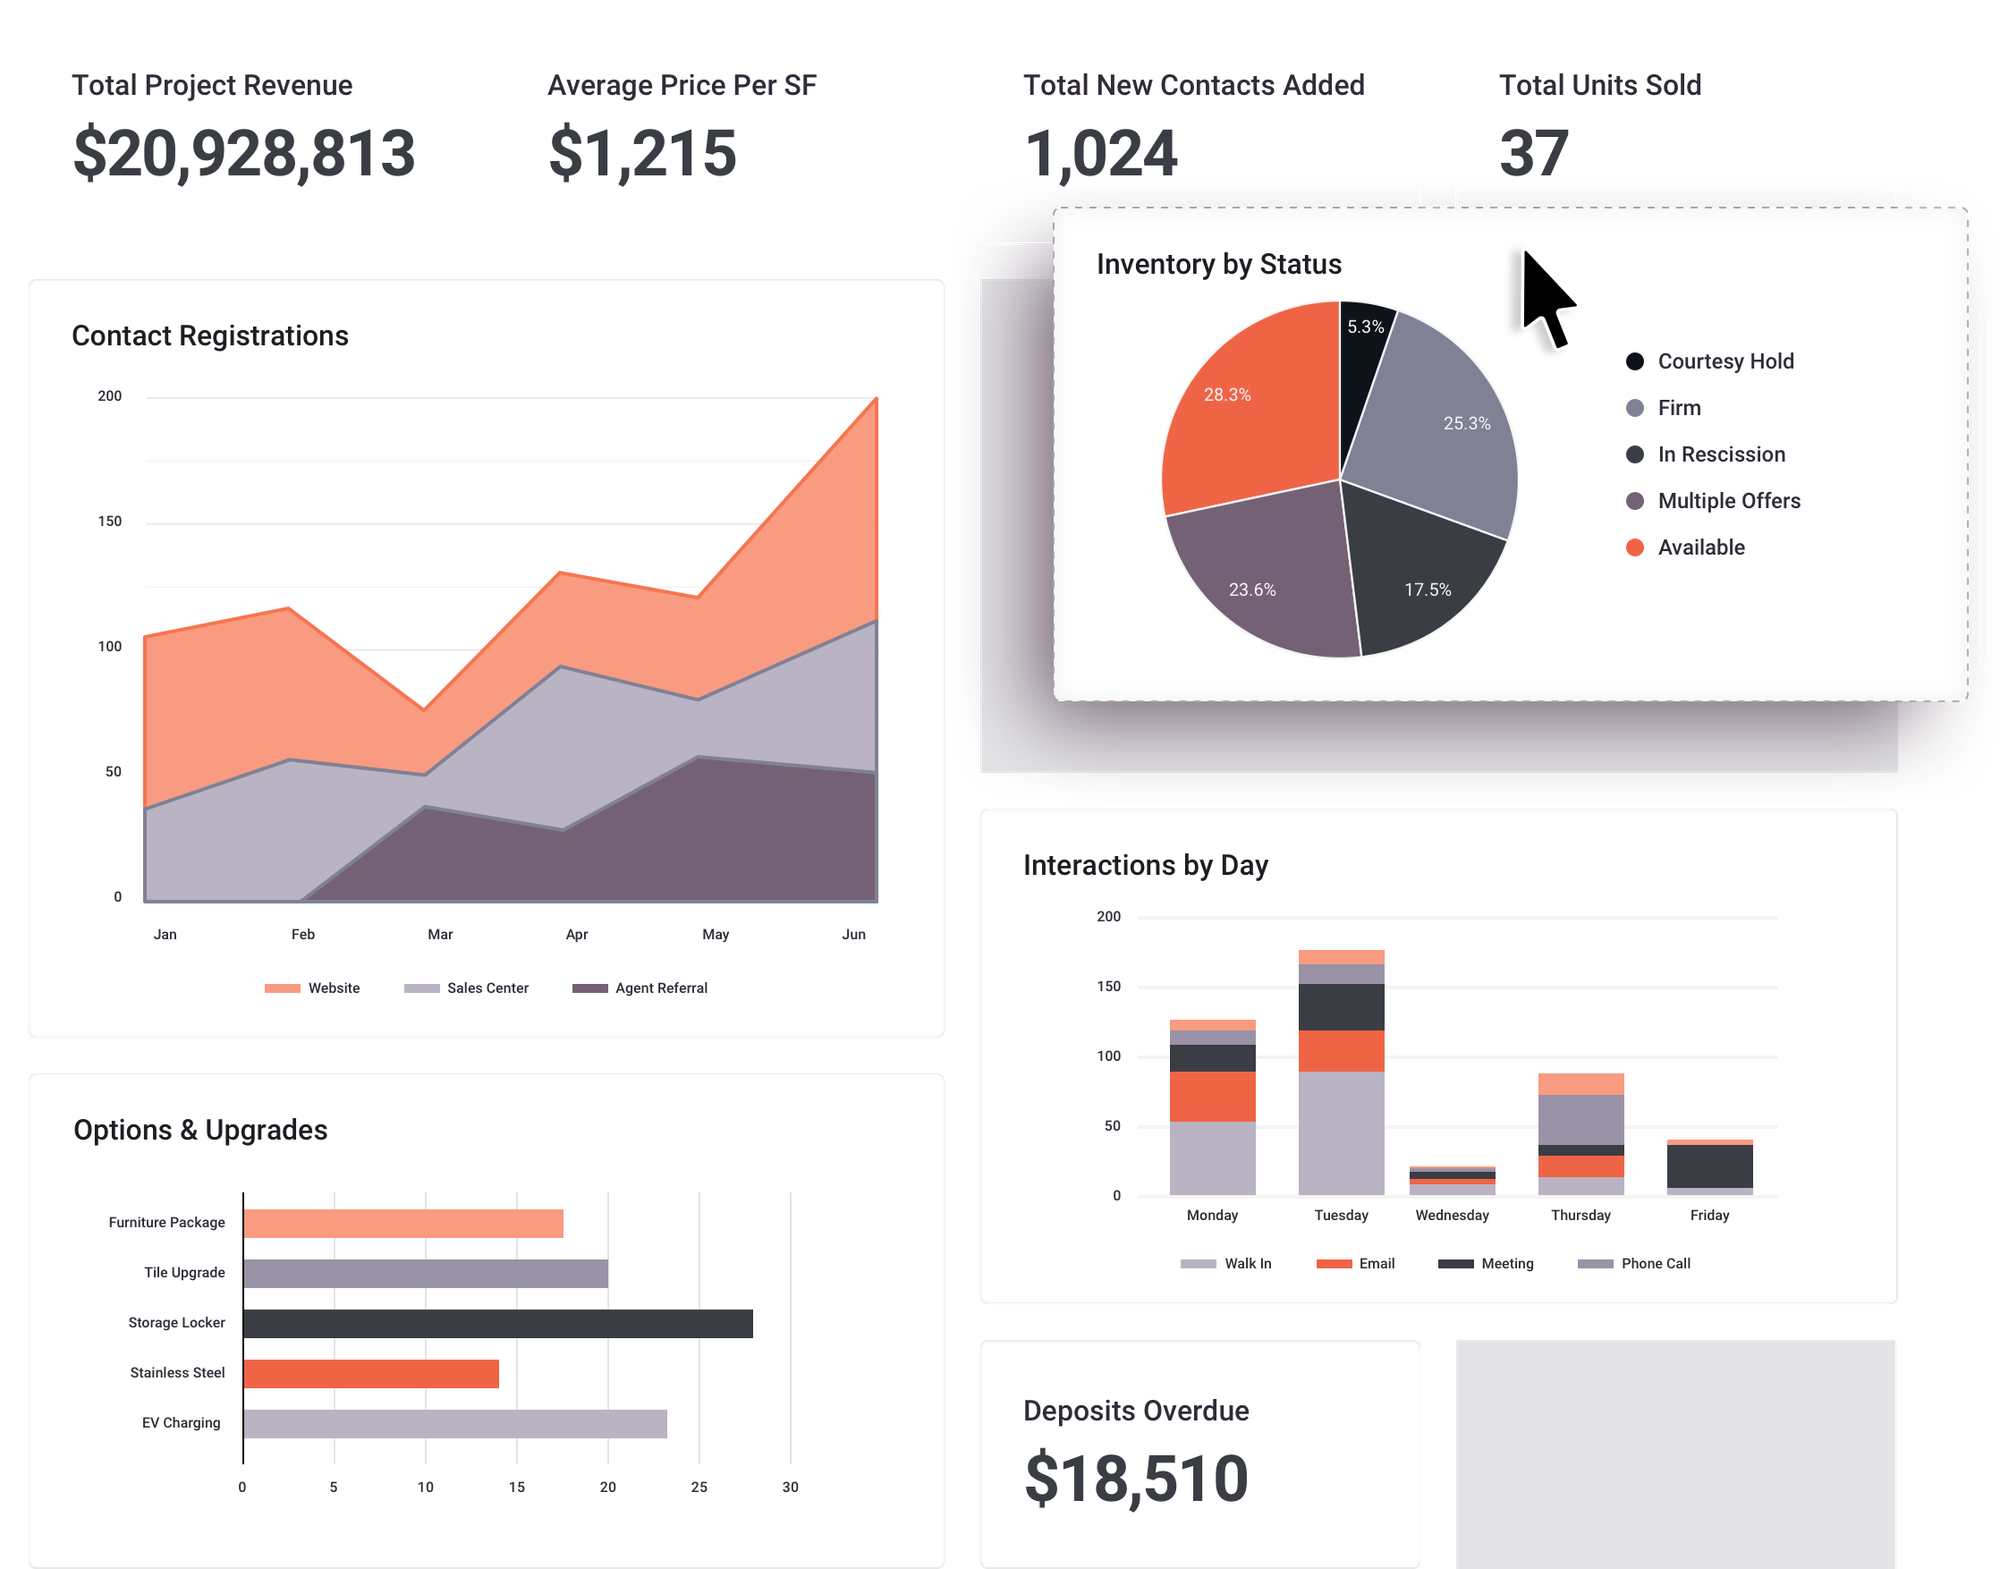
Analytics gives you the power to easily create dashboards using all of your data points in Spark. This enhanced visibility into your project’s data enables all users to make more informed decisions to reach your sales and marketing objectives.
Key Benefits
- Portfolio Analytics to aggregate and analyze data across all your projects.
- Ready-made reporting Templates built on industry best practices.
- New data visualization options to allow represent your data like never before.
- Data sharing to ensure metrics are updated in real-time across your team.
How it Works
- Create Dashboard: Begin by creating a new dashboard by using a template or starting from scratch. Select which team members can view and edit it.
- Add Reports: Use the report creator to build custom reports by selecting data sources, configuring fields, customizing chart types and applying filters. View a live preview as you build your report.
- Visualize and Share: Organize your dashboard with drag-and-drop functionality, resize reports, and share your insights with the team in real time for collaborative decision-making.
Discover how with Analytics, data can become the central foundation to building your next project by contacting our Sales or Customer Success teams to get started today.